
Integrating Weather Data into your Analysis
5 min read
When performing any type of analysis, one of the most important factors to consider is date and time data. That is what trend analysis allows for us, to be able to see what is happening over time.
Once we have our data by date (or day and hour), often the discussion moves quickly to weather, and how that can impact the results I am analyzing. For example, I’ve done many analyses on electricity usage, sales, productivity and work output, where weather was considered an important factor or driver of these results.
The difficulty is figuring out how to quickly bring in weather data into your data set. If you are just adding a monthly or yearly summary of weather, you can probably do that manually. Usually the challenge is pulling daily or even hourly data in your results.
This is how I do it, but if you have a better method, I’d love to hear about it. Please contact me and let me know!
1) First, make sure you have the date in your data set. Here is an example data set we will use:
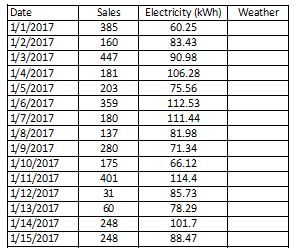
Tip: If you want to determine if day of the week is important to your data, you can use the Excel function called WEEKDAY. This will return a number from 1 to 7, where 1 = Sunday and 7 = Saturday. This may provide an interesting perspective of how your data changes at the beginning, middle or end of a week.
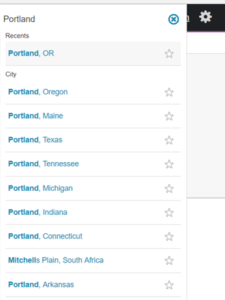
2) Download weather data from Weather Underground. Type in your city and select the nearest one to the data you want. I’ll select my town of Portland, Oregon.
3) This takes us to a summary page. If you need to change to a more specific weather station, you might try searching for that weather station’s call signs. For Portland, I’m using KPDX. Once you find the correct station/location, click on the History tab.

4) Select Custom dates, or select Daily, Weekly or Monthly option

5) If you select the Custom option, enter data range for your data set (our data is Jan-Dec 2017), then click “Get History”

6) At the bottom of the page, you will find all of the history of data by hour within your date range. Lots of data to use, such as: Temperature (High, Avg and Low), Dew Point (High, Avg and Low), Humidity (High, Avg and Low), Sea Level Pressure (High, Avg and Low), Visibility (High, Avg and Low), Wind Speed (High, Avg and Low), Precipitation (Total inches), and Events (weather conditions category like Snow, Rain, Hail, etc).
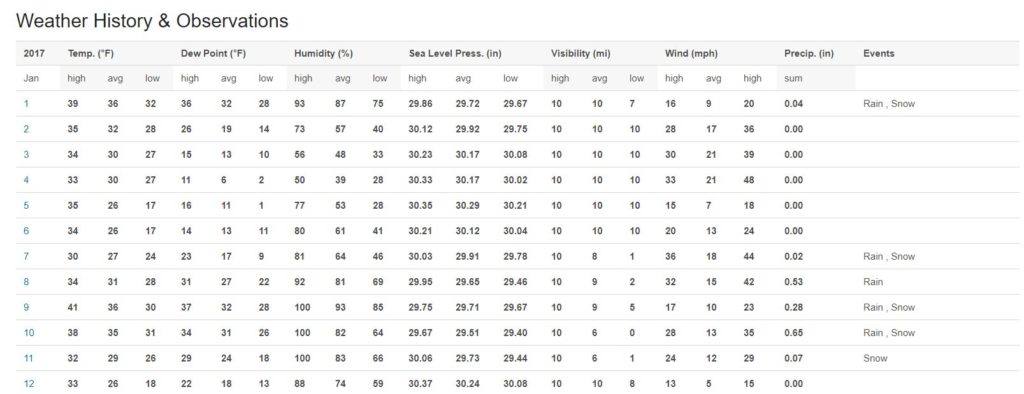
I would highly recommend bookmarking this website URL for future reference.
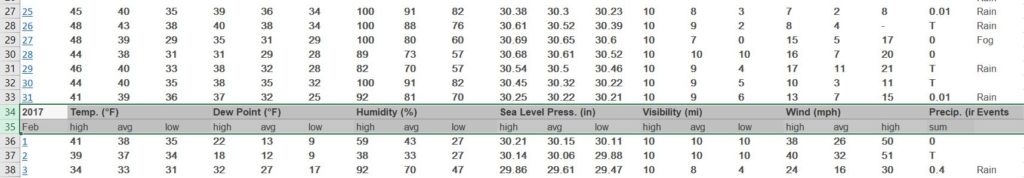
7) Copy and paste this data into an Excel tab of your spreadsheet. You can paste as is, or paste as text, both require the same amount of manipulation.

As you can see, it’s a little messy, and the dates are not in the format we need yet, so this will require some editing. The data is also segmented by month for ease of viewing, but also not good for analysis purposes.
8) Delete the rows that contain summary data by month
9) Add a new column called “Date” and populate it with data that matches the standard date format of mm/dd/yyyy. You can drag and drop the fields to auto-generate the dates in order. These dates should match the information in column A for the year, month and day of each row. Continue this all the way down your file to the end of your data set, and verify that the rows align with the dates properly.

10) Rename and combine the first 2 rows into one column name. I find it easier to create a 3rd row (my new column name), while leaving the existing row, and then I’ll delete the 2 original rows when I’m done.

11) Delete first 2 original rows, along with column A (no longer needed).
Now you should have a cleaned up set of weather data. We will be pulling data from this sheet into our original data set, to populate the weather column. For most data sets, I use either Avg Temp or High Temp. They are highly correlated to each other, so it won’t really matter which one you choose. You could also use Low Temp if you want.
You can probably just copy and paste the data into the sheet manually, and be done.
Or
You can continue and automatically pull in the data using some more advanced functions in Excel. If you use Excel a lot, I would suggest continuing and learning about these cool functions that I use all the time.
12) Create a VLOOKUP formula in your original data set to pull weather data from our newly created sheet. To do this, we need to make sure that the date fields match exactly. Often times, this can be difficult if one is formatted as text, and the other is a date field. Verify you have the same format in each sheet.
The formula you use to retrieve the weather is as follows:
=VLOOKUP(<date cell in your original data>, <range of all columns from your weather data sheet that you might use from new data sheet>, <column number from left to right of your weather data sheet, such as 1, 7, 11, 15, etc>,”False”)
Learn more about the VLOOKUP function in Excel from Chandoo
For the first row, let’s look at that column, which has the formula “=VLOOKUP(A2,Weather!A:U,3,FALSE)”
- “A2” refers to the date field we need weather data about
- “Weather!A:U” refers to the columns A through U in the weather data sheet tab titled “Weather”
- “3” refers to the 3rd column in the “Weather” sheet, where column A = 1, column B = 2, column C = 3. Column C is the Avg Temp column, which is what will be retrieved when it finds a matching row in column A. Note, you should always have column A in the “Weather” tab be the field you are looking up.
- “False” means that we are looking for an exact match, not an approximate match

13) Once you confirm that the cell retrieves the data correctly, drag and drop the cell all the way to the bottom of your file, so that all the weather column is filled in.
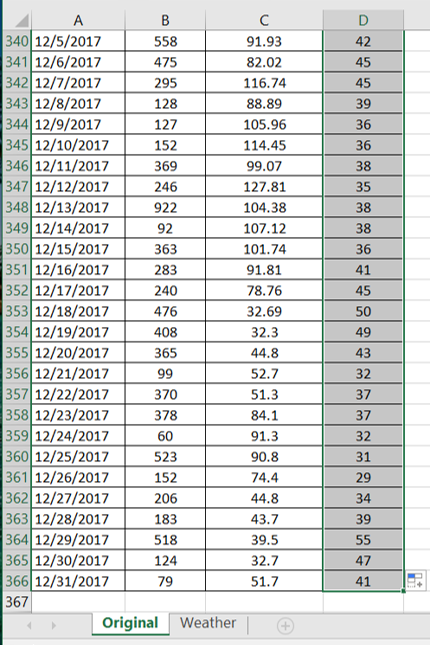
There you have it! Now you can include weather into your data file, and determine how much influence it has on your results. This is really useful when performing Regression Analysis to see what % of influence weather has on the outcomes, as I showed with my prediction calculations for modeling electricity usage article.
Need help or got stuck? You can download the sample data set I used in this example.
Contact me and let me know if you are still having trouble…


