EC 053: Six Sigma Project to Improve Stadium Recycling
Podcast: Play in new window | Download | Embed
Subscribe: RSS
In this podcast, I share the audio from a presentation I created about a Six Sigma project I setup and facilitated a few years back. The project helped improve the recycling program at the University of Iowa’s Kinnick Stadium.
You can watch the video below to see additional photos and information that does not come through in audio only.
Links
- Reducing trash going to the landfill at a college football stadium (2012)
- Kinnick Stadium recycling needs a boost (2009)
Transcript
I’d like to talk about a project I did back in 2011/2012 time frame. I moved back to Iowa City, where I grew up, and started taking sustainability classes at the University of Iowa. That was the third time I’d, basically, enrolled there. I was an undergrad and I also went to grad school there. After a few years, came back and was really getting more into sustainability. Going back to a football game, I realized that there some opportunity there and so I decided to launch a project to try and move the stadium forward a little bit on their recycling program. I’m calling this the Kinnick Stadium Football Landfill Reduction Project.
The idea was to see if I could enhance how recycling was done at the stadium. Growing up in Iowa City, part of the criteria for those in athletics was we had to go clean the stadium on Sunday mornings after every home game and so I got firsthand knowledge in high school about what was going on and then, as a player at the University of Iowa, it was completely out of my purview because I wasn’t at the games, but in the games. But then going back as a fan later and my sustainability hat – or my goggles were on I guess – I noticed that there were some opportunities there. Probably in 2009 is when I first started to pay attention and then, by about 2011, when I started enrolling in classes and getting more connected with the university in the environmental and sustainability programs, then I felt confident to try to launch that initiative. Because I didn’t really know how to get started, so those connections were really important.
What I was able to determine was that, in 2011, there was a study that they estimated about 25% of the amount of trash that was generated was being recycled and the university has a goal of getting to 60% diversion by 2020. That was my problem statement that I was able to uncover and, basically, through the 2012 spring and through the 2012 football season in the fall, I was able to help with an initiative to try and change how the recycling was done and make it a little bit better. And then, in 2013, the program was carried on through the UI staff and fraternity, which I’ll go into a little bit later.
The first thing I want to talk about is this idea of a project. My background is in Six Sigma and a lot of people don’t know what that is. Those of you who aren’t familiar, it’s basically a data-driven approach to solve problems. It’s a methodical way, basically, to take a problem statement, like I’ve shared, and go through these key steps and have the right approach, the right leadership involved, the right team, the right metrics, and this model that I’ll call DMAIC, D-M-A-I-C, I’ll talk about it in the next slide. With that, you can usually be pretty successful solving any type of problem. I partly wanted to showcase that there is a methodology that’s been successful in business, when I was working in the corporate world, that could be carried over and applied to any issue, even something like stadium recycling. This is something I had been doing since about 2000, so I had been getting more confidence and experience with that methodology.
DMAIC is an acronym for Define, Measure, Analyze, Improve, and Control. It’s a very successful methodology that basically uses data to confirm how big of a problem it is and make sure you have the right data, then use the data to help you get to the root causes of the problem, and then make sure that when you come up with solutions tied back to those root causes, that they’re effective and are successful and you measure that through statistical analysis and that’s how you guarantee that your improvements are valid. I like to think of this DMAIC model as an approach that increases your chances of project success than just following some structured model or just getting everyone together and talking about ideals. One of the nice parts about this is that you don’t get into improvement until later into the model whereas people usually want to jump to solutions and ideas without taking a methodical approach and going through and doing the due diligence to make sure they really understand the problem and what the current status of the situation is.
Let’s walk through these DMAIC steps and how I used that methodology to run this project. And again, this is done as just a volunteer basis. I was just passionate about doing something and showcasing that the methodology of Six Sigma could be useful and I was looking for a good basic case study and so that’s what my motivation was. It wasn’t tied into any specific class but I did end up sharing the project in later classes that I did.
Again, the problem statement is that 25% of the waste was being diverted away from the landfill and being recycled, but that means 75% of it was not. And so we were looking at that percentage as a percentage of the recycling collected as a percentage of the total amount of trash. The team was cross-functional and it represented many different organizations – from the Office of Sustainability to the athletic facility departments to the actual athletic department itself to these services like Aramark and City Carton and I would say Landfill to nonprofit organizations to student organizations to different departments inside the university like parking, operations, and maintenance, to the media group. Some people were heavily involved; some were on call or FYI copied. I think the asterisks on here are the ones that were most heavily involved on a regular basis with our weekly meetings and discussions or on the email chains.
The first thing you do as you’re getting into your process is to map it out and make sure everyone understands how the process works. This took a little bit of time for me to figure out because it was more complicated than I realized. Basically, there’s multiple vendors who handled the trash and the recycling and it also depends on where that is taking place. If it’s in the parking lot or if it’s inside the stadium, those are different suppliers of services for that. So this map was a way for me to visualize and really to understand what the current process was and that’s going to this idea that we don’t jump to solutions; we need to first understand the current state.
Then we looked at the data, which, really, there was not much. Like I mentioned, there was one study done the year before and that was all we had to go off of. In Six Sigma, basically, we’re trying to get a good sample size and make sure that data is from a reliable data source and, if not, then go back and get better data so that we’re not using bad data to make decisions. In this case, we had one data point and there was really no way to go back and get better data, but I often mention this in classes I teach is that I’ll take one data point over no data points. Often, people ask, “How many samples do I need?” Well, it always depends, but more is better than less, and so that one data point is going to have to work with us for this project.
Now, what that means is that it’s going to limit my ability to do any kind of statistical analysis because there really isn’t that much information there, so I’m going to have to gather a lot of data after the fact and my conclusions won’t be as statistically valid. But again, if we can make significant changes in the results, then there won’t be much discussion around that. If a trying to go from 25% to 28% and my 25% is really vague and not clear and not from a completely reliable source that is trustworthy, then people are going to argue that I made actual improvements. If I can go from 25% to something much bigger than that, then there will be less scrutiny around that.
So in the Measure phase, trying to understand the current state of the process, you’re trying to interview and talk to who actually understand the process and get their input and ideas and make sure they convey what’s really going on, and then gather as much data as you can to understand the process. And so those three things were accomplished and now we’re ready to move on to the Analyze phase to say what do we do with this information and knowledge and how do we understand the heart of what’s really going on.
We had the spring game in 2012, which usually takes place in April. And again, this project was launched somewhere around December of 2011 where we got the leadership buy-in and agreement to take on this project and a team put together, so this was our first opportunity, after a couple of meetings, to gather new data and more observations about fan activity, the logistics of what goes on outside and inside the stadium, and observe the stadium cleanup activity.
Some of the observations that came out of that were a lack of recycling options in the parking lot, the lack of supervision around the recycling bins, so often, they were getting contaminated for many different reasons – lack of signage and stuff like that. Supervision is very important, especially when you have people who are hurrying into a stadium quickly to try to get there for kickoff and the last thing they’re thinking about maybe is the recycling and doing it correctly. Lack of recycling options within the stadium was very clear. There were a few things, but it wasn’t clear and it wasn’t as plentiful as maybe it should have been or could have been. Cleaning up crews didn’t really have many guidelines about the recyclability of different items, and in the concessions and press box areas, they did not have compost bins available where the food was being served in more of a controlled way.
So we weren’t going to have to do a lot of heavy statistics. My background is in statistics, so I don’t mind that and, in fact, I enjoy all that analysis, but for this project, it was not going to be overly complex to figure out what was going on and how to solve this. But again, I really wanted to provide a project structure to this project and the discipline to go through the steps in order and make sure we really understand and involve all the right people upfront so we’re not going back and having to change the plan or we found out new things that we couldn’t do. We wanted to have those discussions early and often. And so it doesn’t mean you need to have a lot of data to be able to do this project format; the DMAIC model works for lots of things.
In the Improve phase, we decided to implement some ideas for the fall season. We set up the weekly meetings with the team to discuss our options and that started early in the summer so we had enough time available to plan out what we needed to do. That was a challenge because we had people who were in university and that’s the time for vacation. Based on the team and their observations, these are the four main activities we identified to go approach and improve upon.
The first one was adding compost bins and single-stream recycling bins to Aramark, who ran the concession stands, so they could do a better job of recycling and composting with all the supplies that they bring in. The other one was to provide single-stream recycling bins at the gate entrances and use student volunteers and good signage and that was a lot of the effort we spent time on. That also serves the purpose of engaging the fans before they got in the stadium where they’re distracted during the game. There’s about seven or eight home games; I can’t remember offhand. A lot of this is from memory, too, because this is seven years after the fact, so some of this project is a little fuzzy. So there was the seven opportunities, at least, for us to try out ideas and get feedback. That was another key thing we were doing was collecting good data after each game and using that to make adjustments to the plan. The third one was single-stream recycling bins placed in the concourse area with signage during the game, so increasing the amount of options for recycling during the game, and the fourth one was single stream items included in the Sunday morning cleanup recycling efforts with the high school volunteers. That was the program that I was involved with when I was in high school.
I’ve got a couple of different slides I want to share and pictures you can look at. Here are a couple of pictures of fans participating in the recycling with the volunteers supervising. There was a lot of discussion about the type of T-shirts to get and what to say on the T-shirt to make sure they were something people would wear and like and enjoy wearing but it was clear that it was tied to the university, things like that. We got a lot of good publicity for the effort or the enhancement of the program. There was already activity going on, so this wasn’t starting from scratch, but as we enhanced the effort and people were seeing the student volunteers and they were able to ask questions and they were seeing that there was good activity going on at the stadium trying to improve the recycling, people were really excited to see that.
We had a lot of great volunteers. Each game we would bring in students and any volunteers actually from the community who wanted to participate and they would have to come in an hour or two before the game and, basically, supervise the trash containers and the recycling and just make sure people weren’t putting things in the wrong spot and then also talk to the fans and then, afterwards, help bring the cans and recycling to a common area and hang out a little bit after the kickoff of the game, but then they would get free attendance into the game, so that was a good trade-off. I’ve used that a couple of times later to get a free ticket to the game, just volunteer, so it was a really good program.
This was an example of a handout we would give to the volunteers. We spent a lot of time trying to clarify exactly what could be put in the recycling bin and what could not. We really wanted to make sure we had clear pictures of what these items are based on actual items that they might come across; not just generic words or saying, so I think that was really important.
Next, I’ll show a video of what it looked like from the fan experience and for the volunteers as they were standing outside as the game was about ready to begin and people were basically cramming in to get to the stadium and how their interactions were. The lines weren’t moving very quickly, but the activity to get things in the bins would happen very quickly and out of the blue.
We were also able to get one of the student-athletes, the quarterback of the team, James Vandenberg, they were able to get him to record a message that was played during one of the games.
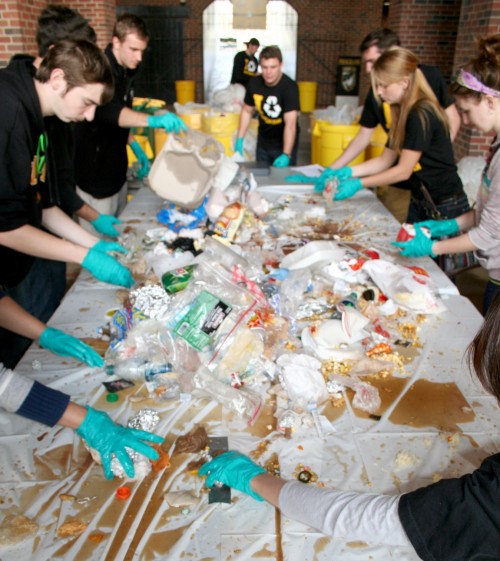
Towards the end of the season, we were able also to do a waste sort, also called a waste audit or dumpster dive. I’ve talked about this as a really good option. I first learned about this through some of the discussions I had with people in the Facilities and Management team who were also in charge of recycling for the university. What I noticed was that they had these events going on and so I just asked if I could be invited to attend a few of them and they said I could. I participated in I think two of them in different buildings in the university and then, when this project came up, I thought this would be a great idea to engage the students to really understand the problem at a much deeper level and really understand what are we dealing with when we look at the opportunities in the trash.
So here are some of the pictures from that event. Basically, what we did was stayed after the game and everyone had agreed to come back and participate. We laid out this big table and took all the trash – it wasn’t all the trash, I think we took a sample of maybe 20 or 30 containers and we split them up. In the picture, you can see that the majority of it was trash and, a few of them, we were able to consolidate into recycling bins, and that gave us a breakdown of our results.
I’m going to play a video for you to show you some highlights from the waste sort so you can get an idea of what that entailed.
And then like every waste sort, there’s a breakdown at the end based on the amount of tonnage that is collected and sorted through, how that broke down. We saw some opportunities there with the parking lot, we saw some more opportunities with composting, especially in from the fans’ perspective, and then just the containers themselves where recycling bins were dwarfed by the number of trash bins and so that was evident when we look at the data, that most of the recycling was getting into the trash. We had a lot of good discussions about how can we improve that without impacting the flow of fan traffic. We don’t want to create a bottleneck where someone is trying to stop and look to see which bin do I put this in and, all of a sudden, there’s a backup. Bad things can happen when you have 70,000 fans trying to leave or enter into a stadium.
This was the data we collected from each game, so we did have seven contests and the results. We did see variation and fluctuation in the results; some games were better than others. Sometimes the amount of water bottles being sold, based on the weather, could impact the amount of recycling and, other times, the weather was bad then we wouldn’t have as many volunteers out, maybe the amount of fans that showed up would be lower so there’s a higher contamination rate, or some of the recycling would get kind of ruined because of the weather, so that affected things as well, the same with the cold conditions. But overall, we were seeing much better results than our baseline that we had the year before. Before, we had about 25%, and if you look at this graph of the data, you can see that we were running closer to 40 to 50, and even as high as 60% during one of the games. That showed us that we were making some progress and were doing pretty good work and I was really excited to see some of those results come through.
So we’re having success and that was the whole goal of the project, so that was great news to see and to see that we never really dipped below the old baseline level. That really gave me confidence that this was true improvement even though we didn’t have the statistics to back it up in terms of sample sizes and P values and stuff like that.
The Control phase is often overlooked in a project is how are you going to keep this going in the long-term? Great, you have this burst of effort and everyone is excited and now what happens next year in 2013, 2014 and now we’re approaching 2019? how does this program maintain itself? that was a really important piece that the university staff did a great job of taking on and coming up with some good options for. First of all, my role on the team changed because I actually was moving to Portland at the time so I couldn’t be there for the whole season. In fact, I wasn’t there but I did come back for a game or two. Luckily, they had a new recycling coordinator that was involved in the 2012 activity and they jumped right in and continued that effort, so that was excellent.
The management team and the facilities department were really strong advocates of this and they really enjoyed the program and they went out and found a fraternity who would take responsibility for finding the volunteers each week for the games, so that took care of the volunteer side of it. So they had a university staff person coordinating the whole effort and then the fraternity was taking on the volunteer piece of that. We also had to established some metrics and data from each game, and so we had that continuing to occur and those numbers would be reported and collected and the feedback would be used during discussions that the recycling coordinator would share and communicate out to the group.
To summarize, the results were a doubling of the diversion rate from 25% to an average of over 50%, and we had a high of 61% against Penn State. In total, we had 47,000 pounds of trash diverted from the landfill during the 2012 season, so that’s a lot of trash, 20 tons of trash that we kept out of the landfill, so that’s a really big success as well.
One of the tools in my process improvement world is called the A3 summary report. What that means, basically, is that you use a sheet of paper that’s called the size of A3, which is a metric size. It’s basically an 11 x 17 sheet of paper and you consolidate a project into a one-page summary. The idea is that you can’t put all the details into the project; you have to simplify your visuals and your verbiage in order to make it a quick read for somebody to get the highlights. It’s a good communications tool and so there’s an example here and you can see some of the details when I zoom in.
All of the slides and details I’m happy to share. I have my contact information coming up here, you can reach out and learn more about it. But that’s not the end of it; I’ve got some more things to cover that we did.
I also tracked every school. I wanted to create some competition to show where is the University of Iowa in comparison to other Big Ten schools who have reported any kind of diversion numbers. During the 2012 football season, not every school had data to report; we had 10 of the 14 schools had reported some diversion numbers during the season. That could have been every game that they reported or one game they reported the number. I just took their highest or their best results and put it on a chart here. The one that had the highest was 98.2, Ohio State, and they were pretty consistent. Week-to-week, they were always in the 90s. I think Rutgers had gotten really good but I don’t know if they had kept that up every game. I think they maybe have done that one or two games. Nebraska had some good numbers, and then Iowa fell at fourth, but they were kind of groups together with a couple of other schools. And so again, the idea was just to try and share that information and use the competition of athletics and use that as a motivating factor for people to apply this to recycling and social good; not just on the field.
Since Ohio State was the one leading the pack, we actually had some connections with the university that I was hooked up with and Iowa actually was playing at Ohio State next year, the year after I should say, in 2013. My dad had recently moved to Ohio, so everything lined up pretty well that I decided I wanted to go to that game and maybe benchmark what they’re doing and come back and share that information. So in 2013, my brother and I attended a game in October of 2013. Unfortunately, we lost the game but it was a really good game and it was competitive, so that was good.
I was hooked up with Corey Hawkey, who was running their recycling program at the stadium, and they were striving for a zero-waste football stadium and they had been reporting 90+ percent for the whole season. He met up with us after the game and a little bit before the game so we could see the training that was going on with the volunteers and the setup and then, afterwards, what happened to the trash and the compost that was collected. They basically use a wet and a dry system. During the game, they have a recycling bin for the dry items and a compost bin for the wet and so everything was going into one of those two containers. That seemed a little strange that you could do that, but let me explain the rest of the system and that will make a little bit more sense.
The compost, of course, was being inspected and checked and then taken to a compost facility, so we got to visit that facility. This is another part of the state of Ohio, so there was a little bit of driving involved to get these locations. Here’s a picture there of the compost facility.
The recycling was then taken to a prison facility where prisoners would get the benefit of working on the recycling line if they had good behavior. It might seem kind of strange that someone would get a benefit of having to work through the recycling and sorting process, but the way they set it up with the prisoners was that it gives them a chance to be outdoors, first of all, and maybe keep their mind busy with some new task, but when I talked to a few of the prisoners on that visit, a lot of them said they really enjoyed seeing all of the memorabilia come through. The items that were being thrown away, sometimes there would be clothing that seemed fine or a shirt or a hat or something like that that would come through. And so they felt like, even though they couldn’t watch the games, they were getting to relive some of the experience by seeing the stuff that was coming through there. That really kind of blew my mind a little bit that they really found a lot of value in being a part of that, so it was a benefit for them to actually get to work on that line. That was a recommendation I brought back to the university that says this is an opportunity to take advantage of a resource that could help clean through the guaranteed contamination that’s going to happen in a football stadium. Through that process, they were able to better sort and then come up with the numbers they were getting in the high 90%.
If you have questions, you can reach out to a couple of different groups. If you want to know the current state of the program, I would start with the Facilities and Management team that also handles the recycling program. I believe that’s still tied in together. I’ve seen that the Office of Sustainability also mentions recycling, and so that might be combined now. One of the two organizations at the University of Iowa would have details about current status. And then, usually once a year, there seems to be an article that comes out about the recycling program and what’s going on, so I always get enjoyment reading that and seeing that it’s still going. As far as I know, it’s still happening as of 2019. If you want to get a hold of me and have questions about this Six Sigma or Lean methodology or more details about this project and what was done or you want copies of anything, I’m happy to share that. I have a website, brionhurley.com, or you can go to my business website where I do my consulting, at Biz-Pi.com.
Thanks for your time. Let me know if you have any questions and good luck if you’d like to start a project on your own. I think it’s just having some passion and some motivation to go do it, making some good connections, and then being diligent to make sure you see it through because there will always be barriers and pushback but, through your persistence and a team effort, you can get through those, so I highly encourage you. That really catapulted a lot of my current work and connections with recycling organizations as I got here in Portland. That background of that project really helped me understand and really opened the doors for a lot of great opportunity, so it was well worth the effort put into it.
I would just like to say, if anyone is watching who was involved in this project, I really appreciate all the help. This is not my project; this is definitely a team effort and I needed everyone in that list to participate and assist with that project otherwise it really would not have gone anywhere. Just like any project, you really need a good team behind you, so thanks to anyone who was a part of this and who continues to be a part of it because, hopefully, it keeps going forever.

