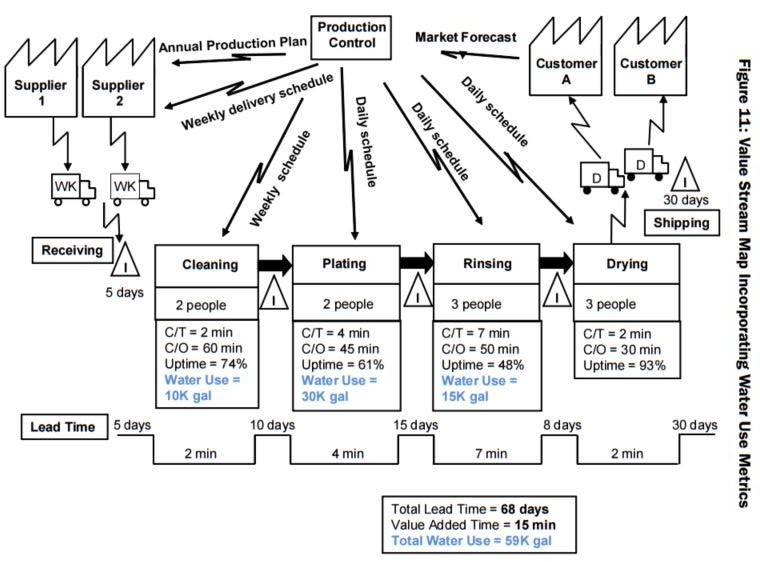
VSM with Water Usage
One way to increase visibility to water waste and opportunities is by including usage data into the data boxes of a traditional value stream map (VSM). Watch a free course on VSM >>>
Here is an example from the EPA’s Lean and Water Toolkit
Note that this map does not include water loss as a result of leaks and evaporation or other losses that can occur between process steps, only water usage by process step.
With water data included on the current state value stream map, your team will be able to include this into the future state value stream map, and easily identify opportunities for increased water efficiency. These opportunities can be included on the implementation plan.
Here is an example from the Institute for Sustainable Manufacturing at the University of Kentucky, showing a break out of cooling water, chilled water and reverse osmosis (RO) water

You can watch the recording of a webinar in April 2019 “Sustainable Value Stream Mapping for Spirits, Brewing and Wine Making Webinar”
Download the EPA’s Lean and Water Toolkit to get more tips and tricks, or contact us for assistance


