Water Balance Map
After completing a water gemba walk, you might consider a water balance map. A water balance map is a diagram to show very simple inputs and outputs of how water flows within your facility. It typically includes every water-consuming component and all flows out of the facility. You might start with this approach, especially if you are just getting started and do not have many water meters setup or detailed water data available (next level of detail below the utility bill).

Benefits of compiling a water balance include:
- Ability to identify processes that present the best targets for reducing water use
- Establishment of baseline water use data, from which improvements in efficiency can
be benchmarked - Creation of a tool with which to compare different water-efficiency improvement
strategies

What information should you collect for a Water Balance Map? Check out this list of areas from the EPA’s Lean and Water Toolkit
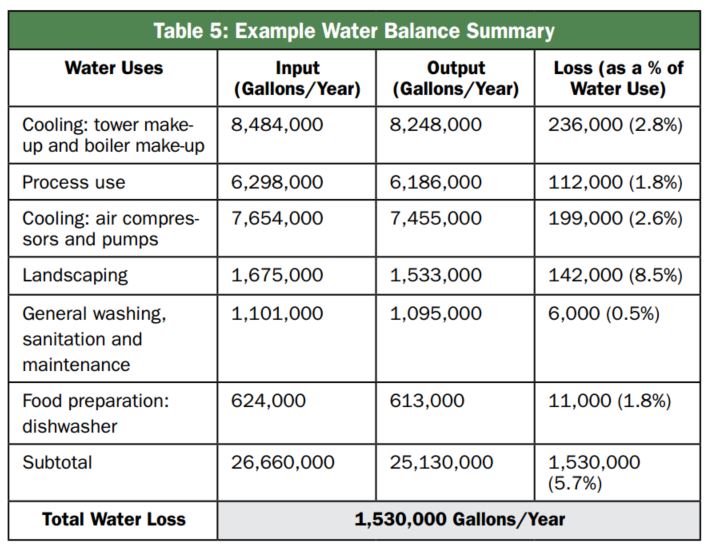
The table below is a summary table of water usage, showing the input, output and loss % by category. Each facility will have different categories, depending on the type of work performed. You can either look for ways to reduce water usage (cooling: tower make-up and boiler make-up at 8.5 million gallons per year), or look for ways to reduce loss (landscaping at 8.5%).
Download the EPA’s Lean and Water Toolkit to get more tips and tricks, or contact us for assistance
