Reducing electricity in a large facility or company
Often times we read about case studies where a company implemented a lighting project, or replaced equipment, or implemented some electricity savings project. However, it’s not very often that the approach on HOW to arrive at that solution is discussed or explained. Perhaps there was no approach, just an idea that got implemented. But that is not the best way to identify the biggest opportunities within a company, and you can’t rely on good ideas alone for your long-term approach to energy management.
Here is an overview of the approach we recommend, to help you get started. The details within each step are explained below.
1. Determine largest energy source for your company or facility
2. Dig deeper to determine smaller areas to focus on
3. Identify potential improvement and validate the opportunity
4. Identify and implement pilot project to validate improvement
5. Get approval and funding for full implementation
6. Complete the implementation and communicate results
You can also follow a traditional DMAIC improvement model as well, which is what we loosely based this approach upon.
We are discussing electricity in this example, but the same thing could be done with Natural Gas or any other energy source. That should be the first step, to identify the largest energy source.
There are two ways to determine the “largest” – based on cost to the company, or environmental impact (carbon footprint). If you are just starting out, perhaps cost is the best way to gain interest from the owner or leaders of the company. If you’re more mature in your environmental initiatives, then carbon footprint should be the priority.
Action #1: Determine largest energy source for your company or facility
Next, we need to dig a little deeper, to determine where we should focus more specifically. If you are looking across your entire company, that might be a Pareto chart of buildings, cities, or departments. Remember, when using Pareto charts, create the chart using different variables, until you find the breakdown that has one or two big impacts, and the rest show minor impacts. That is the sign that you have probably chosen the right variable to prioritize.
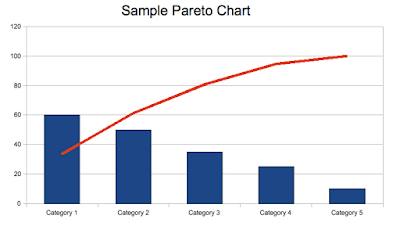 Wrong variable for using Pareto Principle |
 Correct variable for using Pareto Principle |
If you are looking only at one facility, you might be looking at departments, sections of the building, electrical substations or transformers, or where ever you have data below the building level. The key thing is to use the data to dig down as deep as you can, without getting too detailed that you lose your business case for making improvements.
One of the major issues we encounter with many facilities at this stage is the lack of available data to dig deeper. Luckily, there are some ways around that. Imagine you have over one million square feet of floor space within a building with no data except the total KWH used each month. What would you do in this situation? Here’s what we did…
Option #1 – Create a model for electricity usage – By taking the monthly usage data, and matching it will other variables about that month, we can determine which variables will predict future usage. Once we have that information, we can focus our improvements around those variables. Read the entire article about this approach to predict electricity usage using regression analysis >>>
Option #2 – Manual gathering – This is more difficult of the two approaches we will discuss, unless your facility is smaller, or you have tried the analytical approach, and not found anything worthwhile to pursue. The building was so large that we struggled finding variables to measure that would accurately predict the usage, so we had to go with the manual data collection option.
We determined that there were about 50 electrical substations within the facility, and most of them had been updated within the past few years with an electonic display. This display allowed us to get a snapshot of usage at that point in time. So yes, in order to get some data, we needed to find all the substations, and record the date, time and KW of the observation. We tried to take as many observations as possible from each substation. We also had to assign each substation to an area (based on which department owned most of the space), so we could categorize the area for our pie chart or Pareto chart.
![]()
We decided to take reading during off-hours, over winter break, during working hours, and weekends. So for many of the substations, we could only get 3-4 readings, and that was a lot of work. However, even with a small sample of data, we had someplace to start (better than what we had before). After weeks of gathering, we felt we understood about 60% of the total usage in the facility, so we created a pie chart of the usage, and dug into the biggest slices. If you want to understand closer to 100% of the usage, consider investing in data logging equipment >>>

As you can see, we decided to focus on the HVAC equipment, which consisted of the air handler units (AHU) motors and chillers.
One final piece of data we had looked at was the daily KWH usage for the whole facility. As you can see below, the KWH usage during off hours (nights and weekends) is 60% of the highest usage. This seemed higher than we expected, so we felt there was opportunity to save energy during off hours. Unfortunately, this daily usage data was not available below the facility level, so it didn’t allow us to prioritize.

Action #2: If the data is available, dig deeper to determine smaller areas to focus on
Next, we needed to understand the current state of the cooling process that used the AHU motors and chillers. We recommend mapping the flow of electricity into the facility and through the cooling equipment (Value Stream Map or Process Flow Diagram), to better understand how the process works. We spent a few hours with the building automation experts, to understand the process in more detail. We brainstormed potential ideas, based on their experience and case studies we’ve read from other companies.
We found an easy opportunity to turn off the air conditioning during off hours. The current state is that the A/C system runs 24/7, just in case someone comes into the building at night or on the weekends, which is encouraged at this company. Previous attempts to shut off the system had received far too many complaints, and to make it easier on maintenance staff and increase employee satisfaction, they decided to leave it running all the time, regardless of how many people were actually working during the off hours. That being said, the opportunity was so large (based on some “back of the napkin” calculations) that we decided to revisit this issue, to see if we could come up with a different solution.
Action #3 – Identify potential improvement or existing problem and validate the opportunity
To obtain a more accurate estimate of the potential savings, and to make sure we could work through the potential complaints and concerns from the Facilities department, we needed to implement a pilot project. We found a section of the facility that had an isolated substation (data was easy to track), contained multiple types of working space (office, labs, and manufacturing), and was small enough that we could implement in a short amount of time.
We completed the following activities within the pilot project:
- Measured AHU motor performance to determine baseline usage when fully running
- Sent survey to all employees in the area asking for concerns about a setback program, such as:
- What time do you normally work?
- Do you work on weekends?
- Any temperature requirements for your job or equipment you use?
- Any general concerns about wider temp ranges?
- Review badge swiping data from Security department, to verify arrival and leave times for area
We gathered the feedback, and made sure our plan addressed the concerns. The survey also served as a good communications to the employees in the area, to help with the change management needed to make this successful.
For this situation, we decided to implement a custom plan for each AHU, based on the working space and the equipment capability. We had seven AHUs, and we implemented a setback on six of them. The seventh one was connected to an engineering lab that had lots of equipment left on during off hours for long term testing, where high temperatures could negatively affect the test results. During off hours (determined to be 6:00PM to 6:00AM based on badge swipes and survey results), the AHU system would be shut off, unless the temperatures went above 78 degrees, then the system would automatically turn back on. In addition, if an employee came in during off hours and was too uncomfortable, they could press a button on the wall, that would activate the air conditioning for 2 hours at a time.
Action #4 – Identify and implement pilot project to validate improvement
We tracked the results for three months (to be extra safe), and had great initial success! There were very few complaints (most due to lack of knowledge about the override buttons), and the savings amounted to $3000 in electricity costs. For one full year, that equated to $12,000. The best part was that this pilot area was only 5% of the square footage in the facility, so a quick estimate of savings for a full implementation of the setback program could be over $200,000!
We got approval to proceed, but ran into some labor issues with work priorities and roles and responsibilities. It delayed the project significantly. However, because we had a solid basis for our cost savings estimates, and we had kept leadership engaged in the project each month, the project never died. We kept working through these labor issues, and the full implementation finally kicked off.
Action #5 – Get approval and funding for full implementation
The rest of this project was typical of any other improvement project, so I’ll breeze through the rollout phase. However, due to the sensitive nature of employee comfort levels and temperatures, we decided to handle each area the same as the pilot project. We requested feedback and concerns via survey, then communicated the override buttons and implementation schedule. Finally, we tracked at least one month of results, and specifically requested feedback after the program was in place, to make sure there were no new issues to resolve. Signs were also placed above the override button explaining the program, and why it was being done, along with the environmental improvements we expected to obtain with their support of this initiative.
At a minimum, communicate the results to your company through your internal websites and email. Employees need to hear about these projects and improvements, even if they aren’t directly affected. It tells the employee that the company is concerned about the environment, and open to hearing about ways to reduce energy or environmental hazards. I would also recommend setting up presentations for other locations or buildings in your company that could implement a similar project, so they can ask questions, learn what worked, what not to do, and who to contact for help.
If you want to publish an external press release, there is potential that it can expose your company to some harsh criticism (depending on your current reputation for environmental stewardship), but overall I feel it is a good thing to do. It shows the community and stakeholders that your company is trying to do the right thing (as long as the results are legitimate), and it is not seen as “green washing”.
Action #6 – Complete the implementation and communicate results
One reason I wanted to explain the details behind this project is because most press releases you read about do not go into this kind of detail. All it would have said was that we implemented an off hour setback program, without any details on the process and effort it took to get to that point. This is why many companies cannot replicate these ideas in their own company, because the steps that company took (research, planning, data collection and analysis, approvals, ROI calculations, pilot projects, etc) are the key steps that made them successful. This off hour setback program was not a new idea, but it would have never been implemented had we NOT followed a structured approach.
Hopefully, more companies will share details about the “process” they used to arrive at their improvements, not just the improvement that was implemented, so other companies are better able to replicate their successes.


Lean and Green Business
[…] We launched a project to accomplish a 5% reduction in electricity at headquarters, using the Six Sigma DMAIC (define, measure, analyze, improve, control) approach for conducting projects. The project identified an air handler setback opportunity using employee input, statistical analysis, and observations. The project was very successful, saving over $200,000 in electricity and reducing around four million kilowatt hours (kWh), which equates to 2,800 metric tons of carbon emissions. Details on the project can be found here: http://green.qmss.biz/reducing-electricity-in-a-large-facility-or-company/ […]